Tourism Statistics 2019 to Today: Europe’s Tourism Fully Recovered in 2022

TL;DR: Our analysis indicates that the European tourism industry fully recovered to pre-pandemic levels in 2022.
Introduction
In this blog post, we will delve into an analysis of the nights spent at tourist accommodations in Europe from 2019 to the present day. This analysis is crucial for understanding how the tourism industry has evolved, especially in light of the COVID-19 pandemic. We will present data visualizations created using Python, employing various libraries to retrieve and analyze the data.
Methodology
The data used in this analysis was sourced from Eurostat, the statistical office of the European Union. We retrieved the data programmatically using the pandasdmx Python library which allows for easy access to SDMX (Statistical Data and Metadata eXchange) data. For data manipulation and analysis, we used the pandas library, and for visualizations, we employed matplotlib.
Data Visualizations
1. Grouped Bar Chart: Year-over-Year Comparison
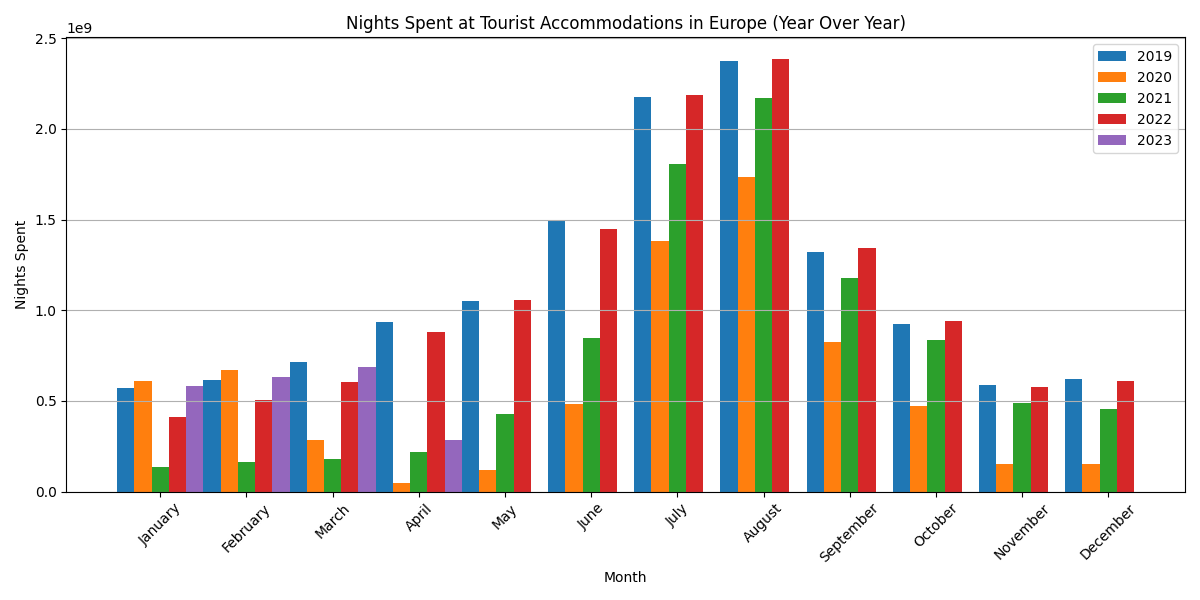
Our first visualization is a grouped bar chart that displays the number of nights spent at tourist accommodations in Europe by month, comparing data year-over-year. The bars are grouped by years, allowing us to directly compare the data year over year. This visualization provides insights into seasonal trends and allows us to observe the recovery of the tourism industry post-pandemic.
Insights:
- The year-over-year comparison shows a noticeable drop in 2020, which corresponds with the travel restrictions and lockdowns due to COVID-19.
- There is a general pattern of increased nights spent during summer months indicating the peak season for tourism.
- The comparison also reveals that 2022 shows a robust rebound, surpassing the pre-pandemic numbers, which suggests a strong recovery.
2. Line Chart: Time Series Analysis
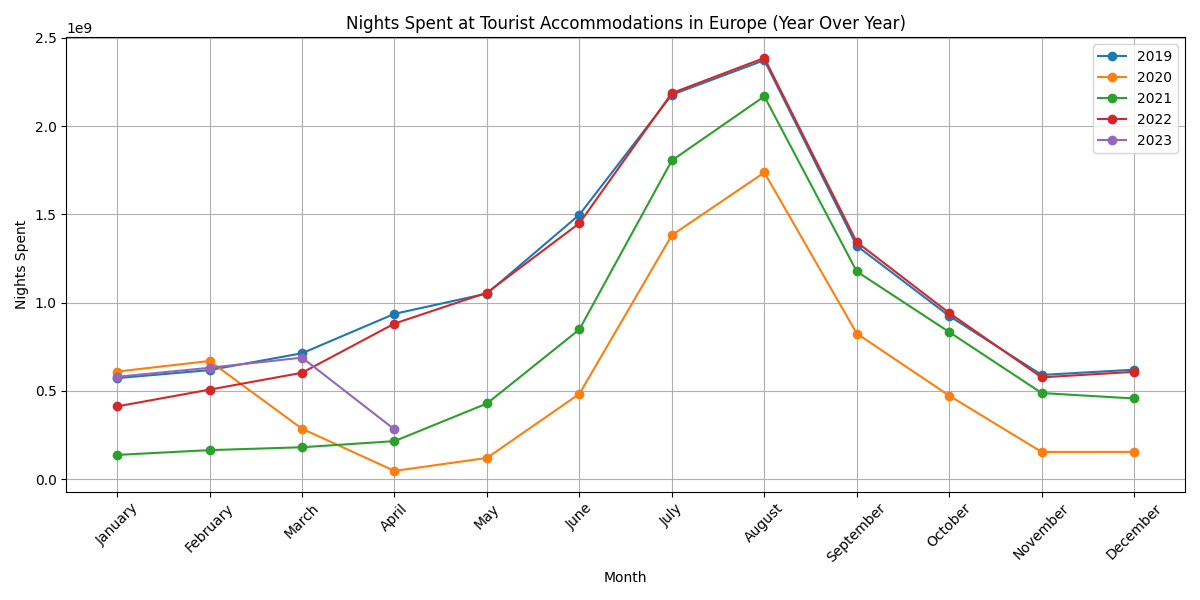
The line chart displays the number of nights spent over time. This representation provides a clear overview of the evolution of tourism in Europe and helps us recognize patterns and possibly identify correlations.
Insights:
- The time-series data demonstrates seasonal trends in the tourism industry, with peaks typically occurring in the summer months.
- The sharp decline in 2020 coincides with the onset of the COVID-19 pandemic.
- The subsequent increase from late 2020 and through 2021 into 2022 indicates a resurgent interest in travel as restrictions ease and vaccines become widely available.
3. Stacked Bar Chart: Cumulative Analysis
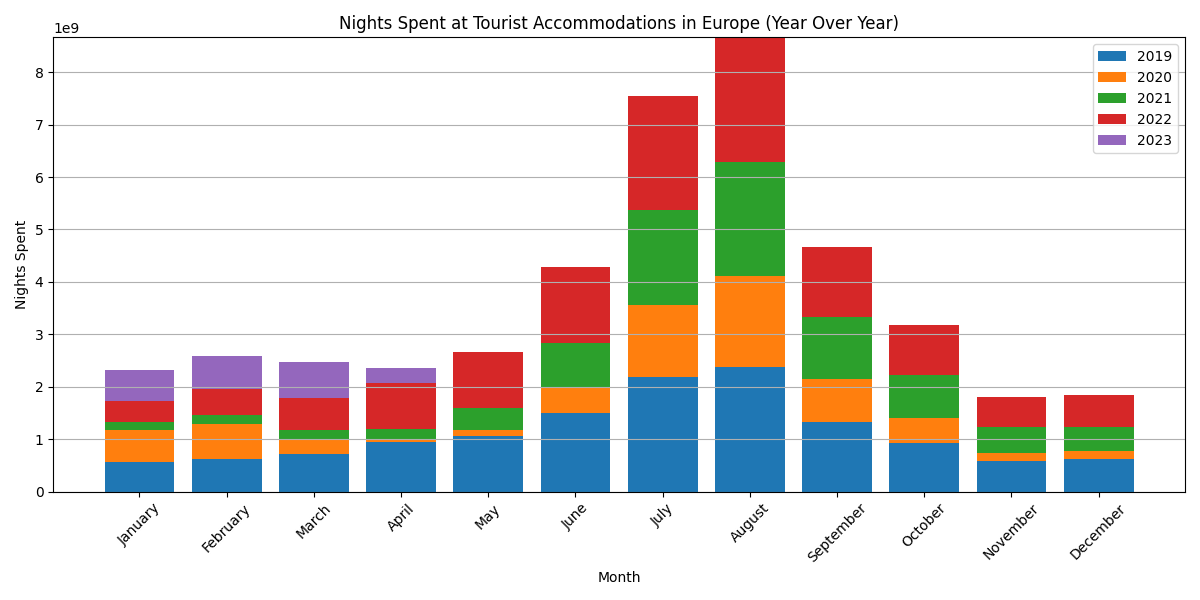
Our final visualization is a stacked bar chart which presents a cumulative view of nights spent across all countries on a monthly basis. Each color in the bar represents a different country. This chart allows for an overview of the total nights spent, as well as the individual contributions from each country.
Insights:
- Seasonality is evident as there is a consistent pattern of peaks and troughs within each year. This suggests that certain months are more popular for tourism, likely due to weather, holidays, or cultural events.
- The recovery from the impact of the COVID-19 pandemic can be observed by comparing the colors that represent 2020 with subsequent years. The data for 2022 indicates that tourism has rebounded to levels comparable to before the pandemic.
- The stacked nature of the chart allows us to observe the cumulative effect of nights spent, which is useful for understanding overall growth or contraction in the tourism industry over the years.
Analysis and Conclusion
The European tourism industry has shown remarkable resilience considering the unprecedented challenges that arose from the COVID-19 pandemic. Our analysis, based on nights spent in tourist accommodations, indicates that the industry has fully recovered to pre-pandemic levels in 2022. This speaks volumes about the adaptability and resilience of the tourism sector in Europe. Additionally, the cumulative analysis shows diversity in the contributions of different countries to the overall nights spent, giving insights into popular destinations and differing recovery strategies.
One key finding is that the tourism industry has already rebounded to its pre-pandemic levels as of 2022.
It is essential to continue monitoring the trends as the sector can be influenced by various factors such as travel restrictions, economic conditions, and consumer preferences.
We hope that this analysis provides valuable insights for stakeholders in the tourism industry, policymakers, and individuals interested in the evolution of tourism in Europe. Further analyses can also include factors such as types of accommodation, spending, and transportation trends for a more comprehensive understanding.
Table of Contents